
toolprint: Know What You've Got, and What You Actually Use
I have a problem you probably share. I genuinely do not know everything that’s installed on my machine. Years of dnf install, go install, pip install --user, a ~/tools folder full of cloned repos, a couple of vendored tarballs, an Android SDK, and Burp Suite Pro sitting in my home directory. Some of it I use every day. Some of it I installed once for a lab back in 2025 and completely forgot about.
I’d been keeping a hand-written “tools inventory” note for a while, and that note had exactly the problem you’d expect. It was wrong the day after I wrote it, because I kept installing things and the note didn’t keep up. So I did the reasonable engineer thing and over-built a solution. It’s called toolprint, it’s written in Go with zero dependencies, and I’ve put it up on GitHub under collininfosec/toolprint (MIT).
This post is less “here’s a tool, go use it” and more “here are the two ideas that made it work,” because both of them surprised me.
Idea 1: Stop writing the list by hand
The reason my note kept going stale is that it was authored by hand. A human maintains the list, and humans forget. The fix is to stop authoring the list and start deriving it instead. I ended up boiling the whole design down to a single line:
Enumeration is derived. Annotation is authored. The gap between them is the product.
There are two halves to that. Enumeration is the “what’s installed” half, and it gets rediscovered from the machine on every single run by a set of small, read-only probes: one for rpm, one for flatpak, one for ~/go/bin, and so on. It’s completely disposable. You can throw it away and re-derive it in about ten seconds. Annotation is the “what is this thing for” half. It’s prose that only I can write, and it lives in a catalog that a probe is never allowed to touch.
Join those two together and every tool on the machine lands in one of three states:
- documented: it’s installed and I’ve described it.
- undocumented: it’s installed, but I never wrote down what it’s for. This is the work queue, the stuff I have but never documented, finally made visible instead of quietly missing.
- orphaned: I described it once, but it isn’t installed anymore. Something got uninstalled, so toolprint surfaces the note for me to delete instead of dropping it silently.
That middle state is the entire point. My old note could never show me “you have 96 tools you’ve never described,” because the note was the list of tools I’d already described. toolprint shows me exactly that, and every one of them is a click-to-fill-in row.
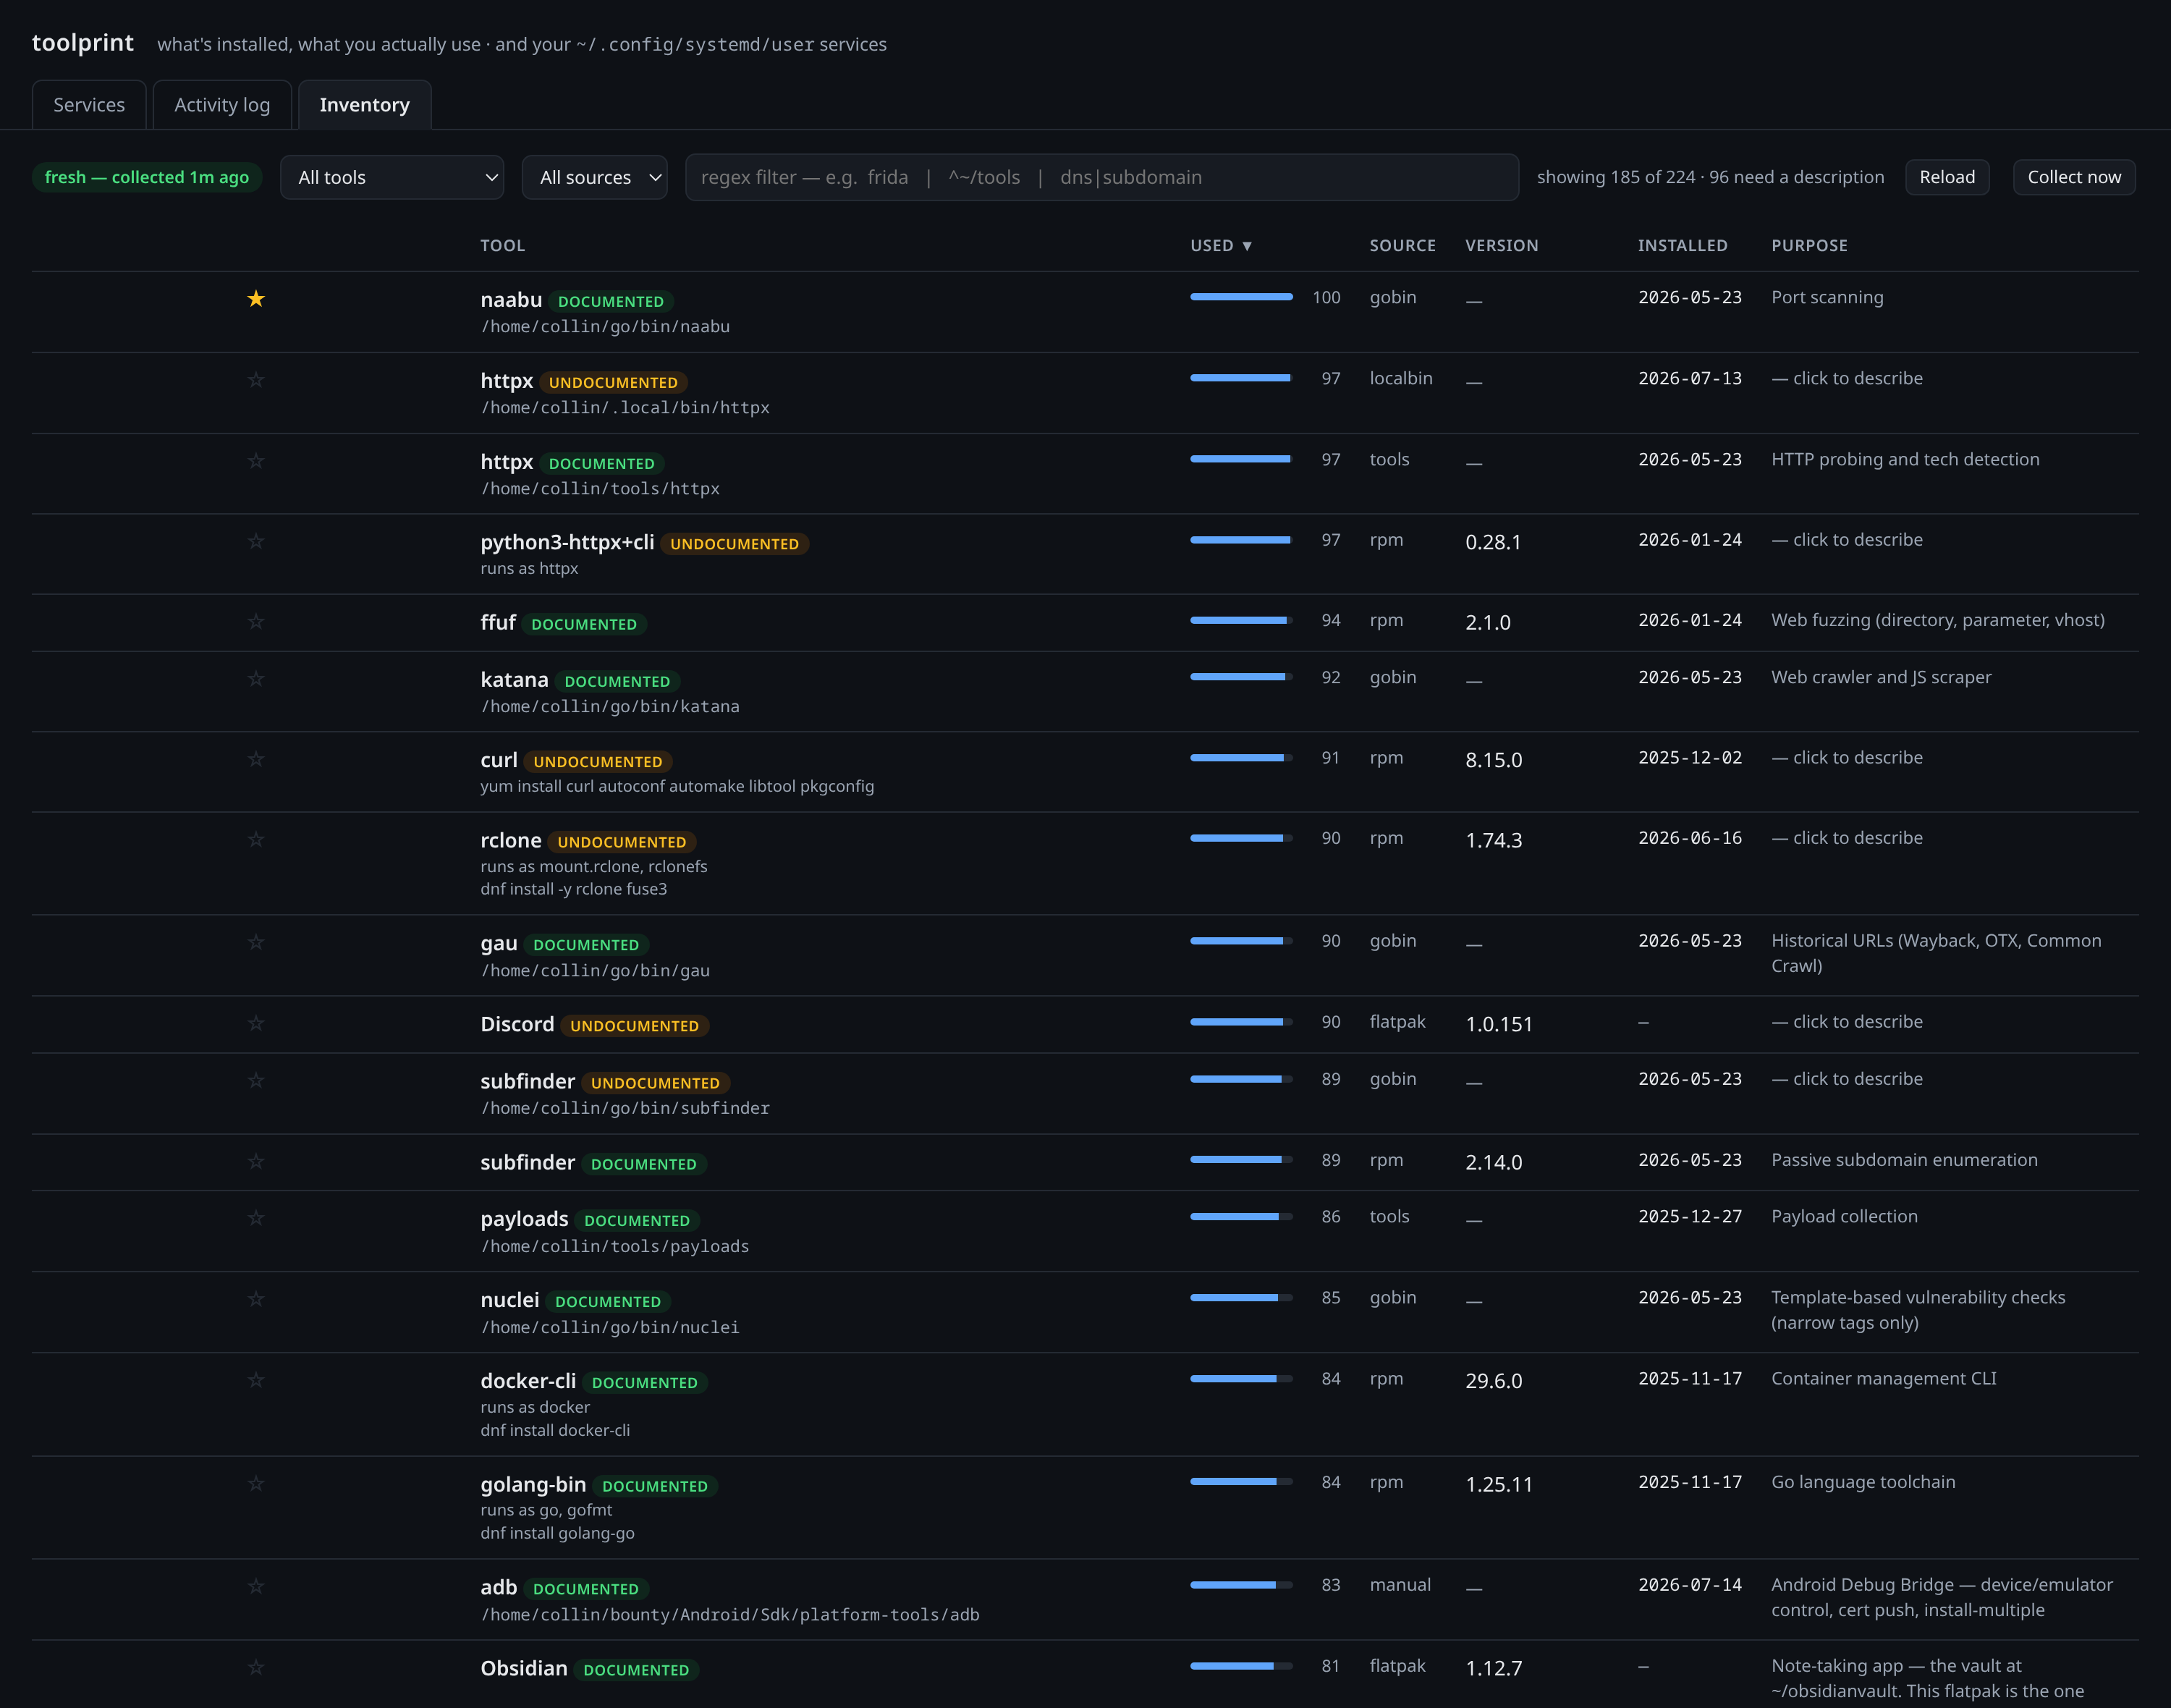
That’s my actual machine. 224 things, 89 with descriptions I’d already written, and 96 still needing one. Best of all, it’s sorted by how much I actually use each one.
The provenance headache
One probe fought me harder than the rest, and that was rpm. If you ask Fedora what the user installed, it hands back around seven hundred packages, because it flags the entire base OS image as user-installed. That’s useless. dnf history has the opposite problem. It’s precise, but incomplete, and some packages have no history entry at all.
Neither one works alone, so toolprint uses both and then subtracts a baseline that it derives from the machine rather than hardcoding. That baseline is the image-build transactions, which it spots by the fingerprint a Fedora image build leaves on its own command line. What’s left is the roughly 85 packages I actually chose. There’s no hardcoded package list, so it keeps working when I install something new. (This part is tuned for image-based Fedora. The repo is honest about that, and it ships Debian and Arch probes too.)
If you think about it, “what did I deliberately install” is a security question as much as a housekeeping one. It’s your attack surface with the noise stripped out.
Idea 2: Rank by usage, and don’t trust the obvious signal
A complete list is still a long list, and a long list in alphabetical order is one nobody actually reads. I wanted the tools I reach for most to float to the top, which meant I needed some signal for real usage. This is where I got humbled a few times in a row.
My first attempt was shell history. It’s the obvious one, since ~/.bash_history is right there. The problem is that mine is capped at 1000 lines, has no timestamps, and barely mentions the tools I use most, because I drive most of my recon tooling through scripts and Claude Code instead of typing it out. Ranking my box by shell history put ll, cd, and nvim at the top and left out nuclei completely. The signal I’d have reached for first turned out to be the worst one available on my machine.
My second attempt was to parse my commands and pull out the program names. Also obvious, also wrong. That approach just gets you cd, ssh, echo, and git. It’s measuring the shell’s vocabulary, not mine.
The thing that finally worked was to invert the search. I already had a complete inventory from Idea 1, so instead of parsing text into tool names, I use the inventory as a vocabulary and scan my usage records for those names instead. That inversion only works because the enumeration is already complete. It’s the payoff for doing the boring part properly.
Even then, I nearly shipped a bug that only measuring saved me from. My richest usage record is my Claude Code transcripts, a couple hundred megs of everything I’ve actually run. My first cut counted a tool name as an “invocation” whenever it sat right after a quote or a pipe. That looked reasonable enough. Then I checked it against the real corpus and found it firing constantly on source code I’d been editing. Things like (code, {, from 'node:path', and even a literal |httpx|katana|naabu| regex from my own codebase were all getting counted as commands.
So I stopped guessing and measured it. Out of about 244 MB of transcripts, only 2.4 MB was real shell. On top of that, the tools I use most never show up at a command prompt at all, because they run inside other programs. That flipped the whole design. Real invocations are precise but sparse, so the better “most used” proxy turned out to be mentions, meaning how much a tool shows up in the work at all, with invocations kept as a precision bonus on top.
The last trap was ordinary English. Words like code, make, curl, and node scored absurdly high, because they’re also just… words, especially inside source files. VS Code cracked my top ten on around 12,000 incidental mentions. The fix is a stoplist: a stoplisted name earns nothing from mentions and is ranked on its real invocations only. code promptly dropped to mid-pack on its few dozen genuine invocations, which is exactly where it belongs.
Here’s the ranking on my box, with the receipts. toolprint shows its work for every score, because a number you can’t interrogate is a number you’ll ignore:
most used:
  100.0  gobin:naabu       invocations=59  mentions=4698  atime_days=15
   97.5  localbin:httpx    invocations=39  mentions=3858  atime_days=15
   93.6  rpm:ffuf          invocations=37  mentions=2708
   91.9  gobin:katana      invocations=42  mentions=2395  atime_days=15
   90.5  rpm:curl          invocations=705 mentions=1679
   89.9  gobin:gau         invocations=33  mentions=2051  atime_days=24
   88.8  gobin:subfinder   invocations=21  mentions=1884  atime_days=66
   85.2  gobin:nuclei      invocations=17  mentions=1338  atime_days=15
That’s right. That’s genuinely my toolbox, in order. And if I ever disagree with it, I can star anything to pin it to the top, because authored intent should always beat a computed guess.
For most people, by the way, shell history is the right primary signal. You type your tools, so your history reflects reality. toolprint auto-detects what you have and leans on whatever evidence actually exists on your machine. Mine is just a bit weird.
It’s also a little dashboard
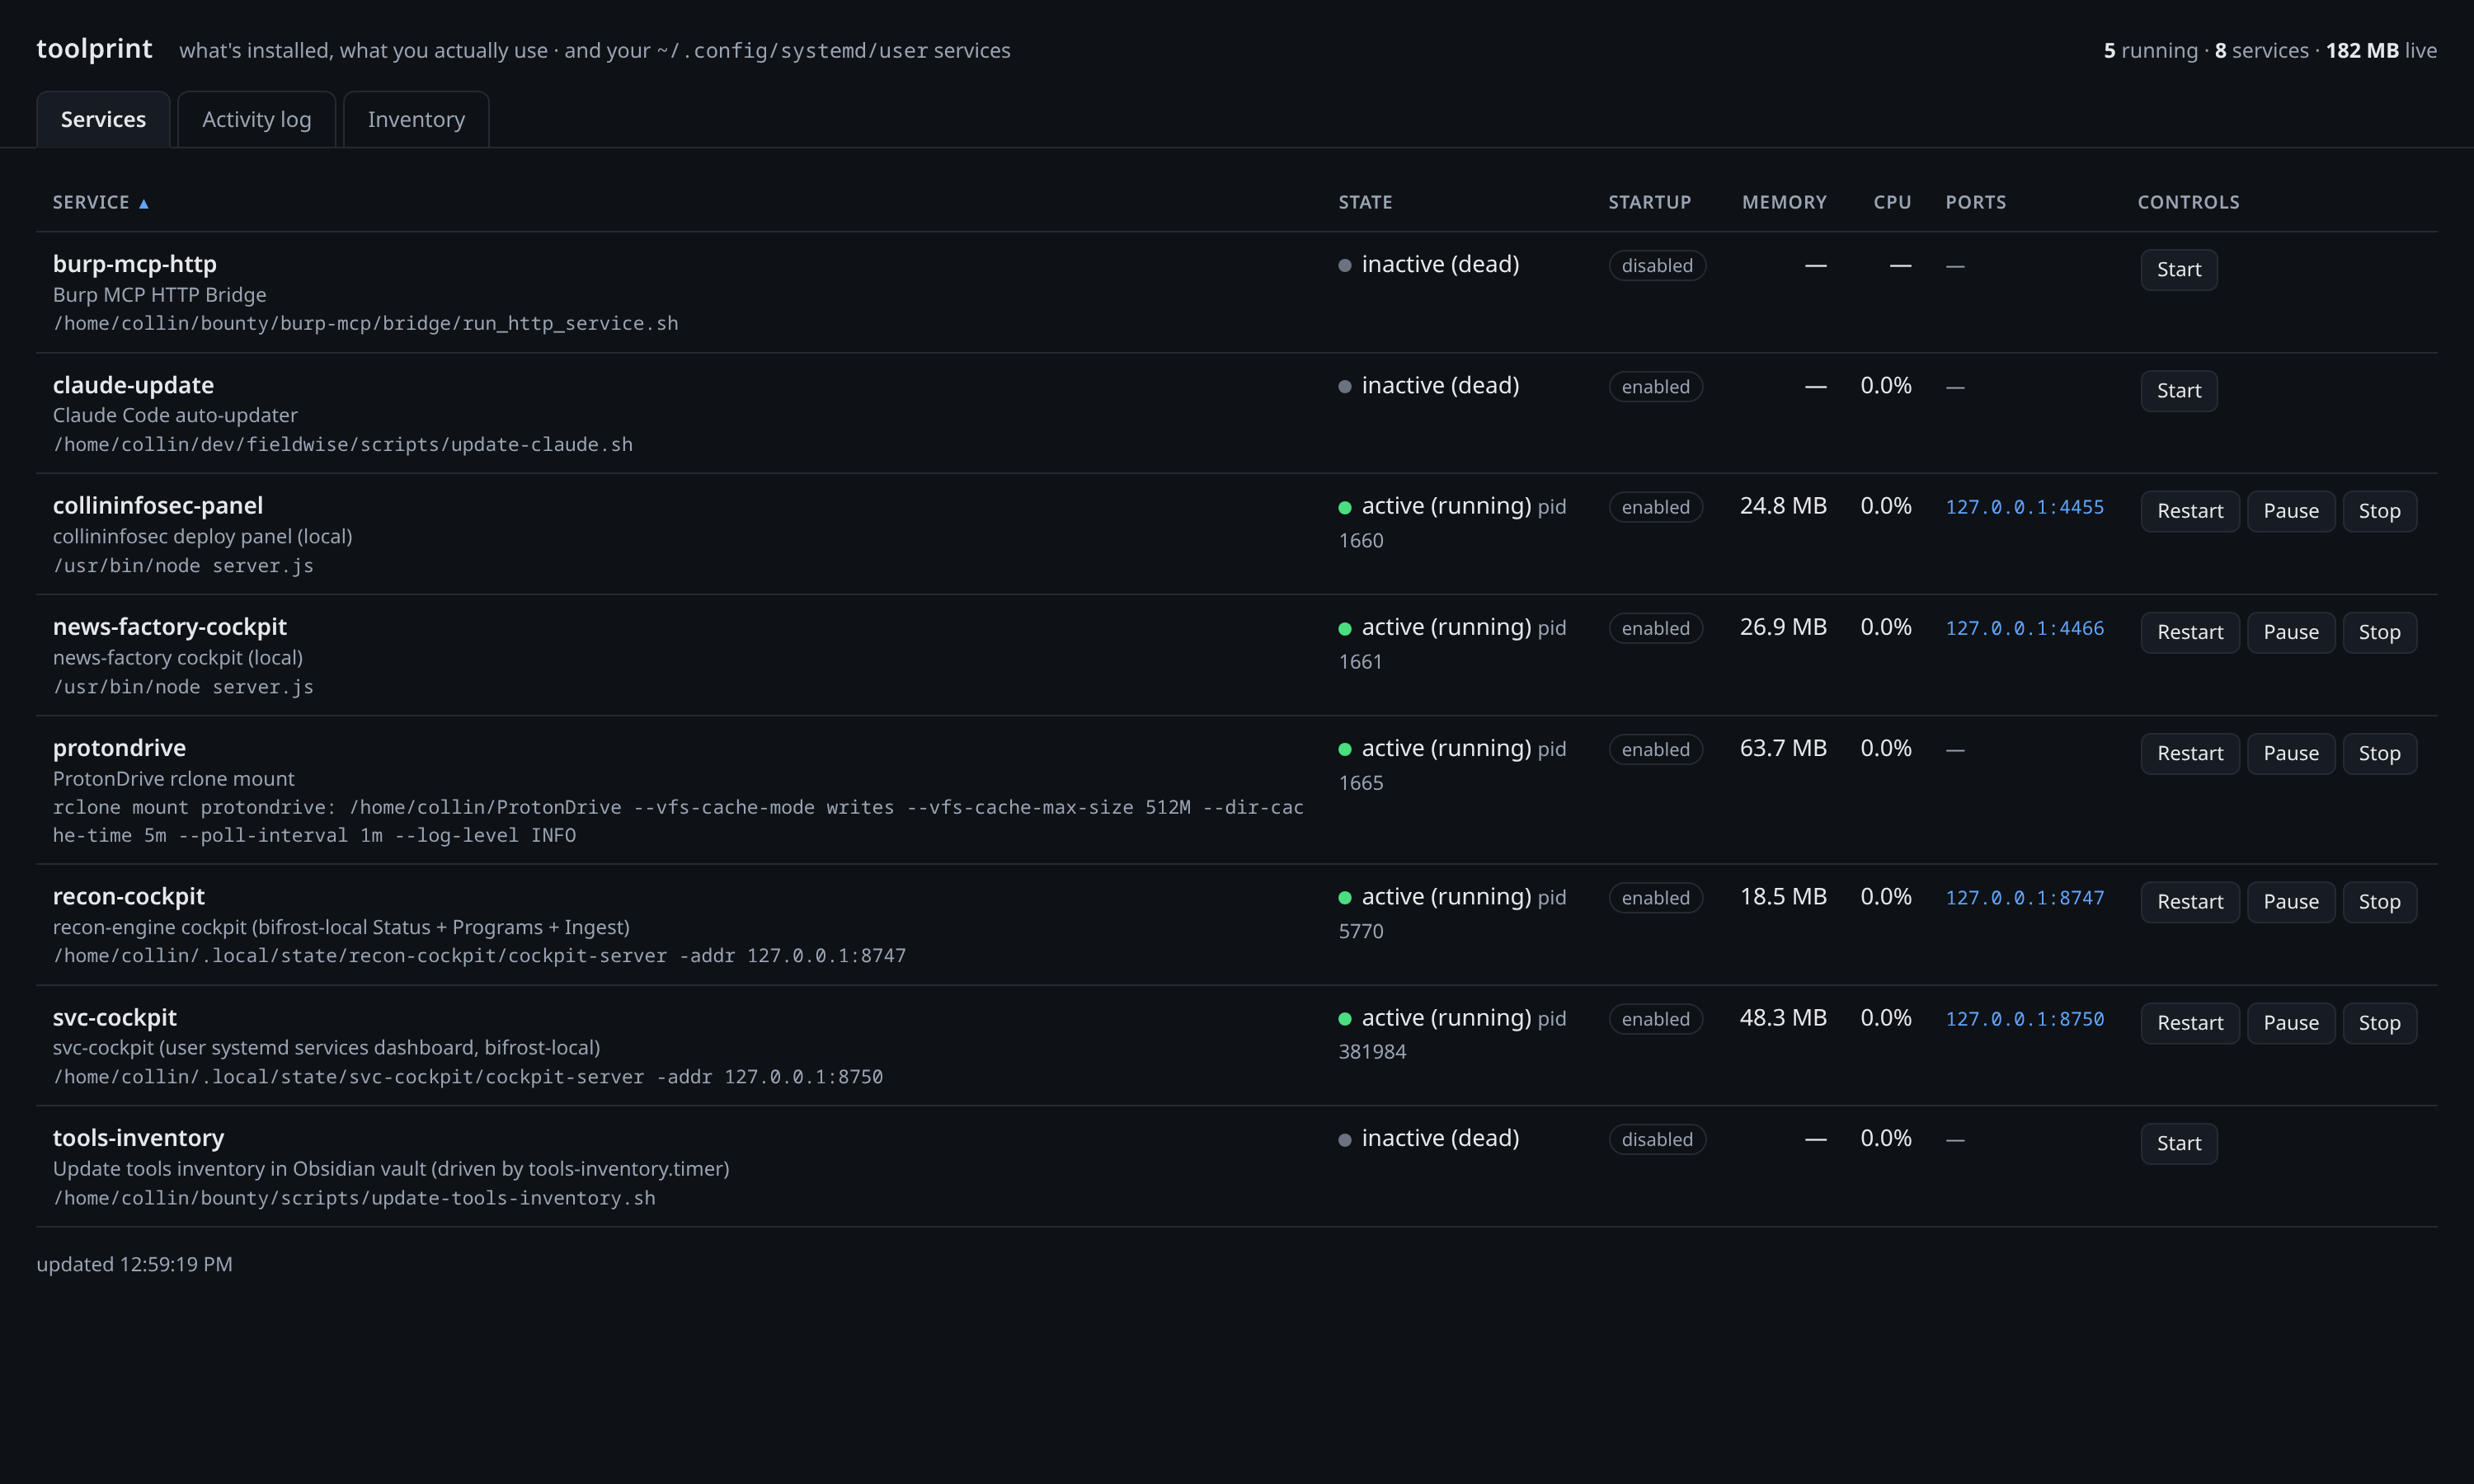
toolprint grew out of a loopback-only dashboard I use to watch my systemd --user services, so that tab came along for the ride. It binds to 127.0.0.1 only, checks for a loopback Host to shut down DNS-rebinding, and gates every state-changing action behind a custom header and a same-origin check. There’s no authentication, because there’s no remote surface to protect. If something can reach 127.0.0.1 on my box, it’s already me.
Make it yours
The part I’m actually proud of is that adapting it to your own machine is a config edit, not a code-reading exercise. You run:
toolprint init
and it inspects your system to see which package managers you have, which tool directories actually exist, and which usage signals are available. Then it writes a starter config describing what it found. From there you just edit that one JSON file: add a directory, point it at a hand-installed app, tune the stoplist. And if you need a source it doesn’t know about yet, a probe is a Go type with two methods and about thirty lines of code.
I try to be honest in the README about which parts are portable (the model, the ranking, the security) and which are tuned to my box (the exact directories, the Fedora provenance rule, and the fact that my primary usage signal is agent transcripts rather than shell history). It’s a reference implementation you bend to fit rather than a brew install, and honestly I think that’s the more useful thing to share anyway.
The code is here: github.com/collininfosec/toolprint. It’s Go standard library only and MIT licensed. If you run Debian or Arch, the package probes are written, but I’ve only exercised them on Fedora, so corrections are very welcome.
The whole thing took an afternoon, and it taught me that I don’t use half of what I thought I did. That alone made it worth building. Thanks for reading, and if you end up bending it to fit your own setup, I’d genuinely love to hear how it goes.